WebCodecs Census
Find the frame you forgot to close.
A leak detector for WebCodecs apps. It counts every VideoFrame,
AudioData and codec a page holds open — including the ones inside a
Web Worker — and hands back the line of code that allocated them.
Quickstart →
Install, attach, read a leak report. Three ways in.
API reference →
checkLeaks, expectNoLeaks, and what a report means.
CI recipes →
Make a leak a test failure instead of a mystery.
Honest limits →
What it cannot see, and what it says instead of guessing.
The problem
WebCodecs objects hold resources from a finite pool outside the JS heap. The garbage
collector never reclaims them; only close() does. Chrome's own guidance is
blunt about the consequence: forget frame.close() and you leak GPU memory
fast.
Nothing in the platform tells you that you leaked one, how many, or where from. The app just gets slower, then quietly stops decoding. DevTools' Media panel lists media players; it does not attribute frame lifetimes. As far as we can find, nothing else does either.
What you get
One call, structured output, no screenshots:
import { attach, launchChrome } from '@motionvector/webcodecs-census-cdp';
import { summarize } from '@motionvector/webcodecs-census';

const chrome = await launchChrome({ executablePath: CHROME });
const session = await attach({ browserURL: chrome.browserURL });
await session.navigate('http://localhost:5173/');

console.log(summarize(await session.census()));   // page + every worker
2 context(s): main, worker
main (3s): nothing live
worker (3s): VideoDecoder=1 VideoFrame=5
5 VideoFrame still live (allowed 0).
Held by:
5x VideoFrame (decoded, oldest 100ms) in worker
at VideoSample.toVideoFrame (pipeline.js:17261:14)
(frame emitted by this VideoDecoder)The last three lines are the whole point. A count alone cannot be acted on; an allocation site can.
Why this is hard, and why it didn't exist
Decoders almost always live in a Web Worker. Page-level monkey-patching — how Spector.js and WebGPU Inspector both work — cannot reach a worker the page created. That is the whole problem, and it has two teeth:
-
A Manifest V3
world: "MAIN"content script atdocument_startis not guaranteed to run before the page's inline scripts. -
Rewriting
new Worker()to load a shim from a blob URL fails outright on any site whose CSP omitsblob:fromworker-src/script-src.
Either failure is silent, and a leak detector that silently sees nothing reports a clean bill of health for an app that is losing every frame. That is worse than having no tool.
The two-phase injection
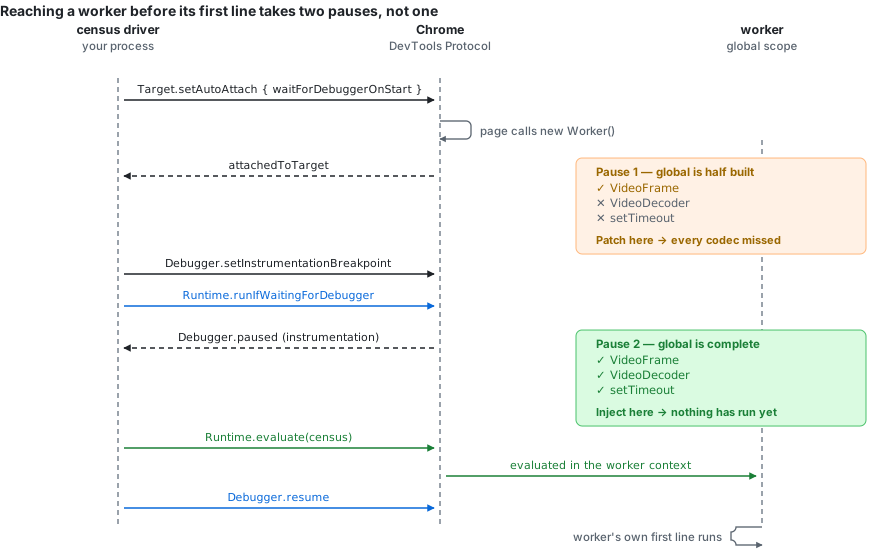
Target.setAutoAttach with waitForDebuggerOnStart pauses a worker
before its first line. Inject there and you catch an allocation on line 1. But at that
moment a dedicated worker's global is only half built. Measured on Chrome 151:
| At the auto-attach pause | Present | Absent |
|---|---|---|
VideoFrame, AudioData, ImageBitmap, EncodedVideoChunk | yes | |
VideoDecoder, VideoEncoder, AudioDecoder, AudioEncoder | absent | |
setInterval, setTimeout, queueMicrotask | absent |
Patch there and you instrument the frame types but miss every codec — most
of what the tool is for. So the driver resumes into a second, later pause: a
beforeScriptExecution instrumentation breakpoint. That fires with the global
fully populated and still before the worker's own script runs. It is the only moment that
is both complete and early enough.
Auto-attach is not recursive, so each attached target arms it again for its children. That
is what reaches nested workers. This behaviour is measured rather than specified, so
test/platform-assumptions.test.mjs asserts it directly and prints what it
found — a Chrome change is reported as a Chrome change rather than surfacing as a
mysterious failure elsewhere.
Decoded frames never pass through a constructor
The frames that leak in production are not the ones you build with
new VideoFrame(). They are created by the platform and handed to the
output callback you gave new VideoDecoder({ output }). An
instrument that only traps the constructor counts a handful of hand-built frames and
misses the entire decode pipeline.
The census wraps the output callback at construction time. Because there are
no application frames above a platform callback, a decoded frame is attributed to
the decoder that produced it — which is the line you can act on.
.clone() is tracked too: it returns an independent handle needing its own
close(), and it also bypasses the constructor.
Why not just take a heap snapshot?
Chrome's DevTools MCP
server gained heap-snapshot tools for agents in Chrome 151, which is the natural thing
to reach for. It cannot answer this question, for three structural reasons rather than one
fixable one. Measured against this repository's own fixture, which leaks five
VideoFrames inside a worker:
| Heap snapshot of the page target | 4 VideoFrame nodes, 84 bytes total |
webcodecs_census | VideoFrame: 5, attributed to the decoder that produced them |
-
Wrong heap. A WebCodecs object's resource lives outside the JS heap —
the entire reason
close()exists. The snapshot measures JS wrappers, so it understates a frame holding megabytes of GPU memory as tens of bytes. - Wrong scope. The leak is in a worker, and a page-target snapshot does not cover worker isolates.
-
Wrong question. A frame collected by GC without
close()is the most definitive leak there is, and it is gone from the heap by the time you could snapshot it. Only aFinalizationRegistrysees it, which is what this does.
The two compose rather than compete: several CDP clients can attach to one page at the same time, so an agent can run Chrome's DevTools MCP for JS-heap and performance work and this one for media object lifetimes.
What it tracks
VideoDecoder, VideoEncoder, AudioDecoder,
AudioEncoder, VideoFrame, AudioData,
ImageBitmap — plus <video> and <audio>
elements. Each live object records how it entered the context, because provenance decides
whether a leak is yours:
| Origin | Meaning |
|---|---|
constructed | new VideoFrame(...) here |
decoded | produced by a codec, attributed to that codec's construction site |
cloned | .clone() — an independent handle needing its own close() |
received | arrived over postMessage; this context owns it now |
Departures are accounted for just as carefully. Transferring a VideoFrame
detaches the sender's handle without calling close(), and the receiver
gets it by structured clone rather than a constructor — counted naively that is a false leak
in one context and an invisible object in the other. A FinalizationRegistry
catches the unambiguous case: an object collected by GC that was never closed. And since
v0.3.0, a codec the platform closed after an error is recognised as gone rather than filed
as leaked, because the spec closes it before your error callback runs.
Who this is for
Anything decoding or encoding in the browser: timeline editors, recorders, transcoders, players that seek by decoding. Clipchamp presented its WebCodecs pipeline at a W3C workshop, and Remotion has folded its media parser into mediabunny and now recommends it. The more of your pipeline lives in a library, the more of it an app-only instrument cannot see.
If you use a toolkit like mediabunny,
you never write new VideoDecoder — the library does. The census patches the
globals, and mediabunny references them at call time rather than capturing them at module
scope, so everything it builds internally is counted.
test/mediabunny.test.mjs builds a real MP4 with mediabunny, decodes it back
through its own sinks, and asserts that the leak lands on the exact method whose
double-ownership contract was broken.
Three packages, one version
| Package | What it is |
|---|---|
@motionvector/webcodecs-census |
The instrumentation core and the assertion API. No dependencies. Reference |
@motionvector/webcodecs-census-cdp |
Injects the census into a running Chrome, workers included. Reference |
@motionvector/webcodecs-census-mcp |
An MCP server, so an agent can do all of the above. Reference |
They share one version, because -cdp and -mcp depend on an
exact version of the core. A Chrome extension covers
the case where you want to look at a tab by hand.
Prior art
- webgpu_inspector — excellent, actively maintained, and the quality bar for this project. Solves the analogous problem for WebGPU. Does not cover WebCodecs.
- Spector.js — WebGL. Page-level patching, same worker blind spot.
- Chrome DevTools Media panel — lists players and logs; does not attribute frame lifetimes.
- chrome-devtools-mcp — the official agent surface for DevTools. Strong at JS-heap leaks and performance; blind to resources held outside the JS heap. Runs alongside this one.